Querying and styling from SQL
Mundi is a fast interface to explore the contents of any complex spatial database. You can add its data to a map, style it with data-driven symbology, and run ad-hoc SQL queries against it.
Because Mundi is primarily driven using LLMs, beginners to spatial databases can query data with no SQL familiarity, while experts can write complex queries faster and spot-check queries for correctness.
Start with our demo PostGIS database
Section titled “Start with our demo PostGIS database”Mundi comes with a pre-built connection to an example PostGIS database you can explore before connecting to your own PostGIS. Here is how to connect to it and a few prompts to run to get the full experience.
Connecting to the database
Section titled “Connecting to the database”Once you’ve created your first map, you can find the demo database inside the database connection menu.
- Click the Load PostGIS icon to get started.
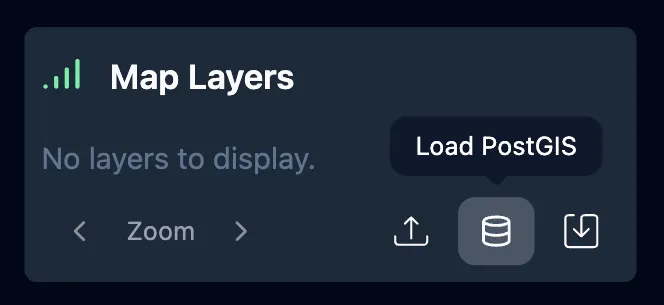
-
The Add a PostGIS Database menu will open.
-
Click the Demo Database button, then Add Connection in the lower right to connect to the database.
![]()
- Our demo has about 100 tables. The connection will take about 2 minutes to load. If it takes longer than 2 minutes, refresh the page.
Example requests to Kue
Section titled “Example requests to Kue”To get a better sense of what Kue can do, try asking:
- what companies control the most pipelines?
- add all of the pipelines and style by in service status with labels
- add all of ConocoPhillips fields
AI database documentation
Section titled “AI database documentation”You can hover over the database name and click on it to view the generated wiki page.
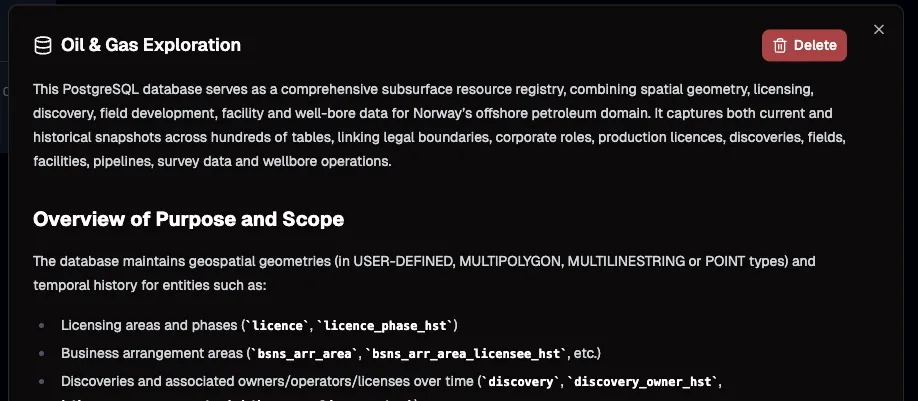
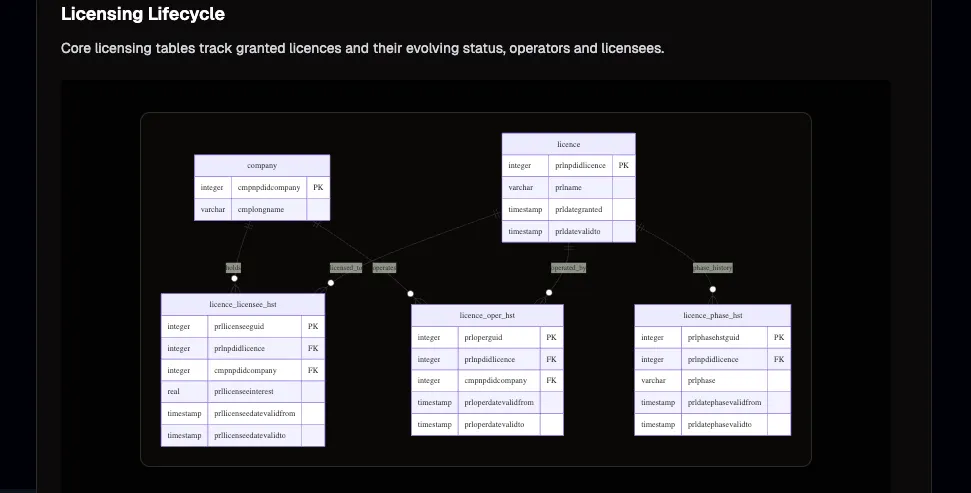
The wiki page is generated by an AI model that sees your database schema, example data, foreign key relationships, etc. It includes diagrams explaining how different tables relate to each other:
Asking questions about the database
Section titled “Asking questions about the database”Between looking at the documentation and adding new layers, you can ask questions about the database. This could be as narrow as “tell me the attributes for this feature” or as broad as “list all of the companies mentioned in the database.”
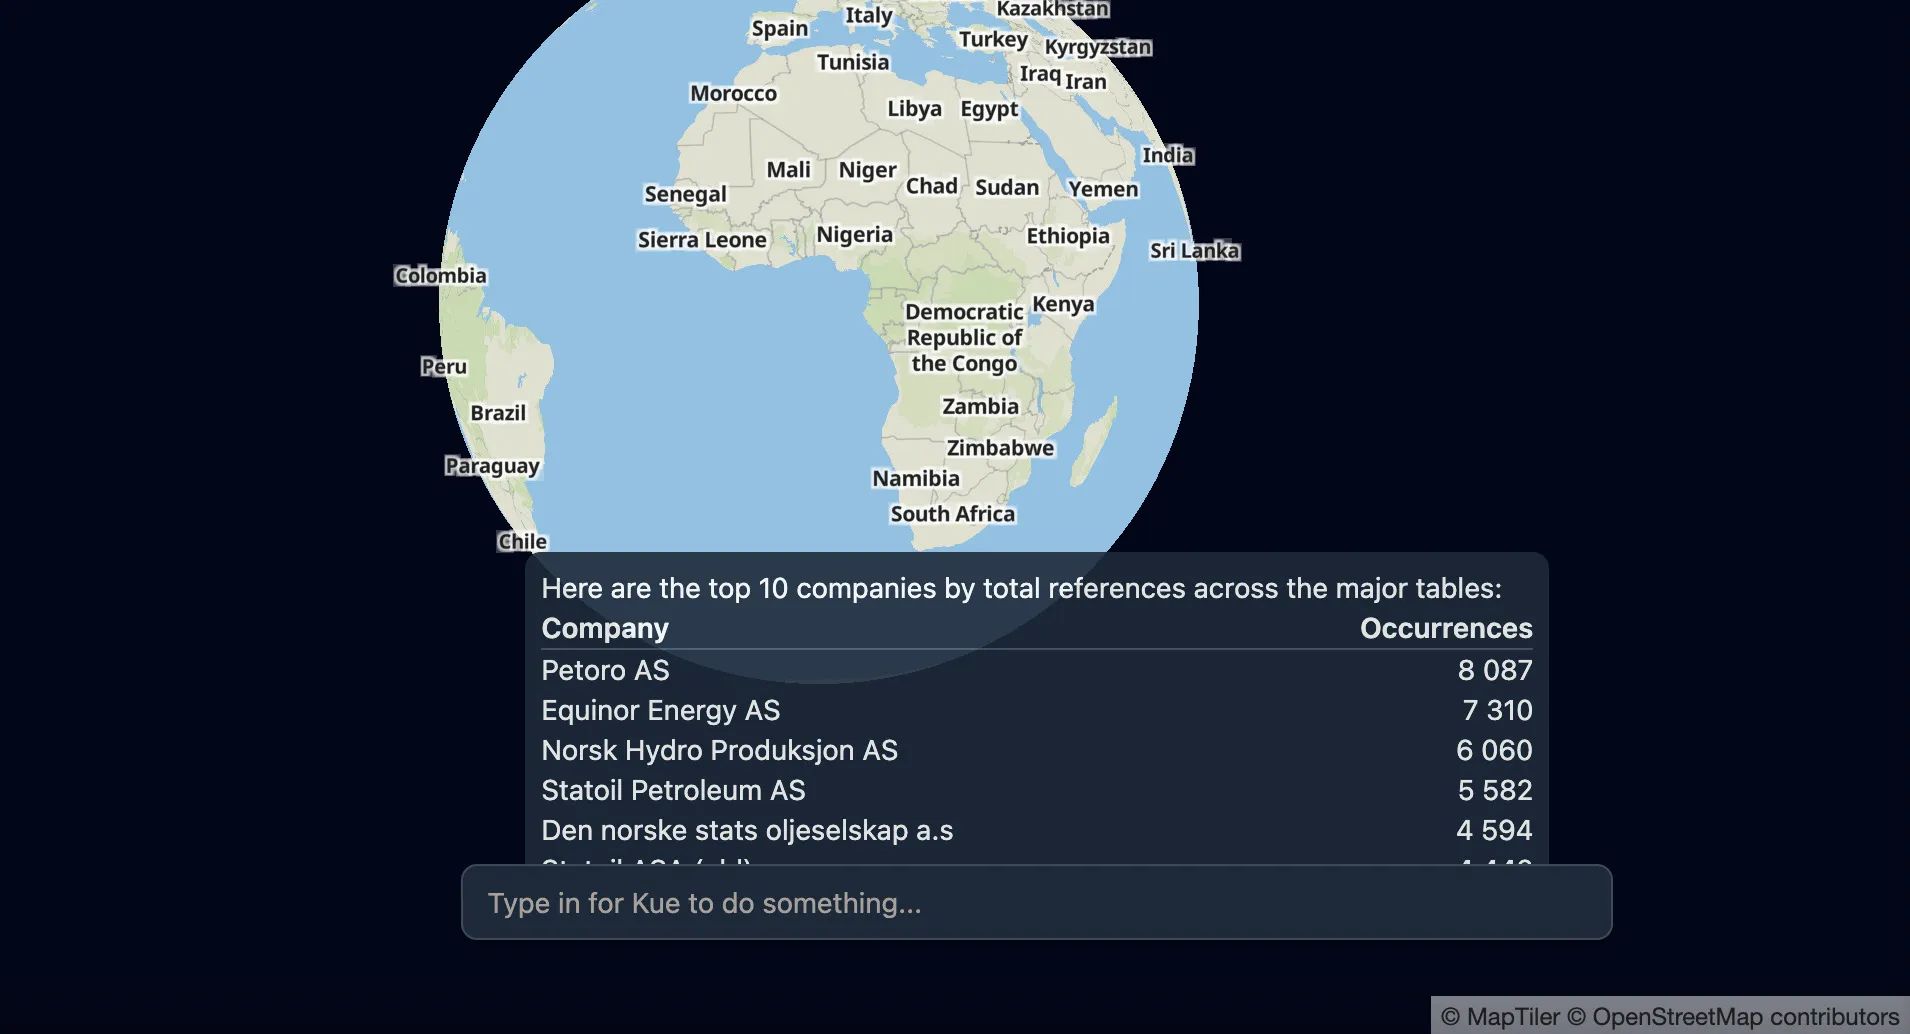
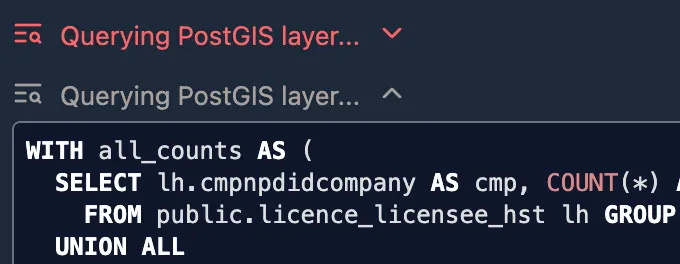
Kue’s SQL from this request
WITH all_counts AS ( SELECT lh.cmpnpdidcompany AS cmp, COUNT(*) AS cnt FROM public.licence_licensee_hst lh GROUP BY lh.cmpnpdidcompany UNION ALL -- ... shortened for brevity ... -- ... 20+ lines of SQL ... SELECT wb.cmpnpdidcompany AS cmp, COUNT(*) FROM public.wellbore wb GROUP BY wb.cmpnpdidcompany)SELECT c.cmplongname AS company, SUM(ac.cnt) AS occurrencesFROM all_counts acJOIN public.company c ON c.cmpnpdidcompany = ac.cmpGROUP BY c.cmplongnameORDER BY occurrences DESCLIMIT 10;Reviewing Kue’s SQL
Section titled “Reviewing Kue’s SQL”You can open the dropdowns in the chat on the right to review Kue’s SQL and learn more about what it is trying to do. If the dropdown is red then it means the action failed. Failed actions are common, and not indicative of a problem.
Selecting features
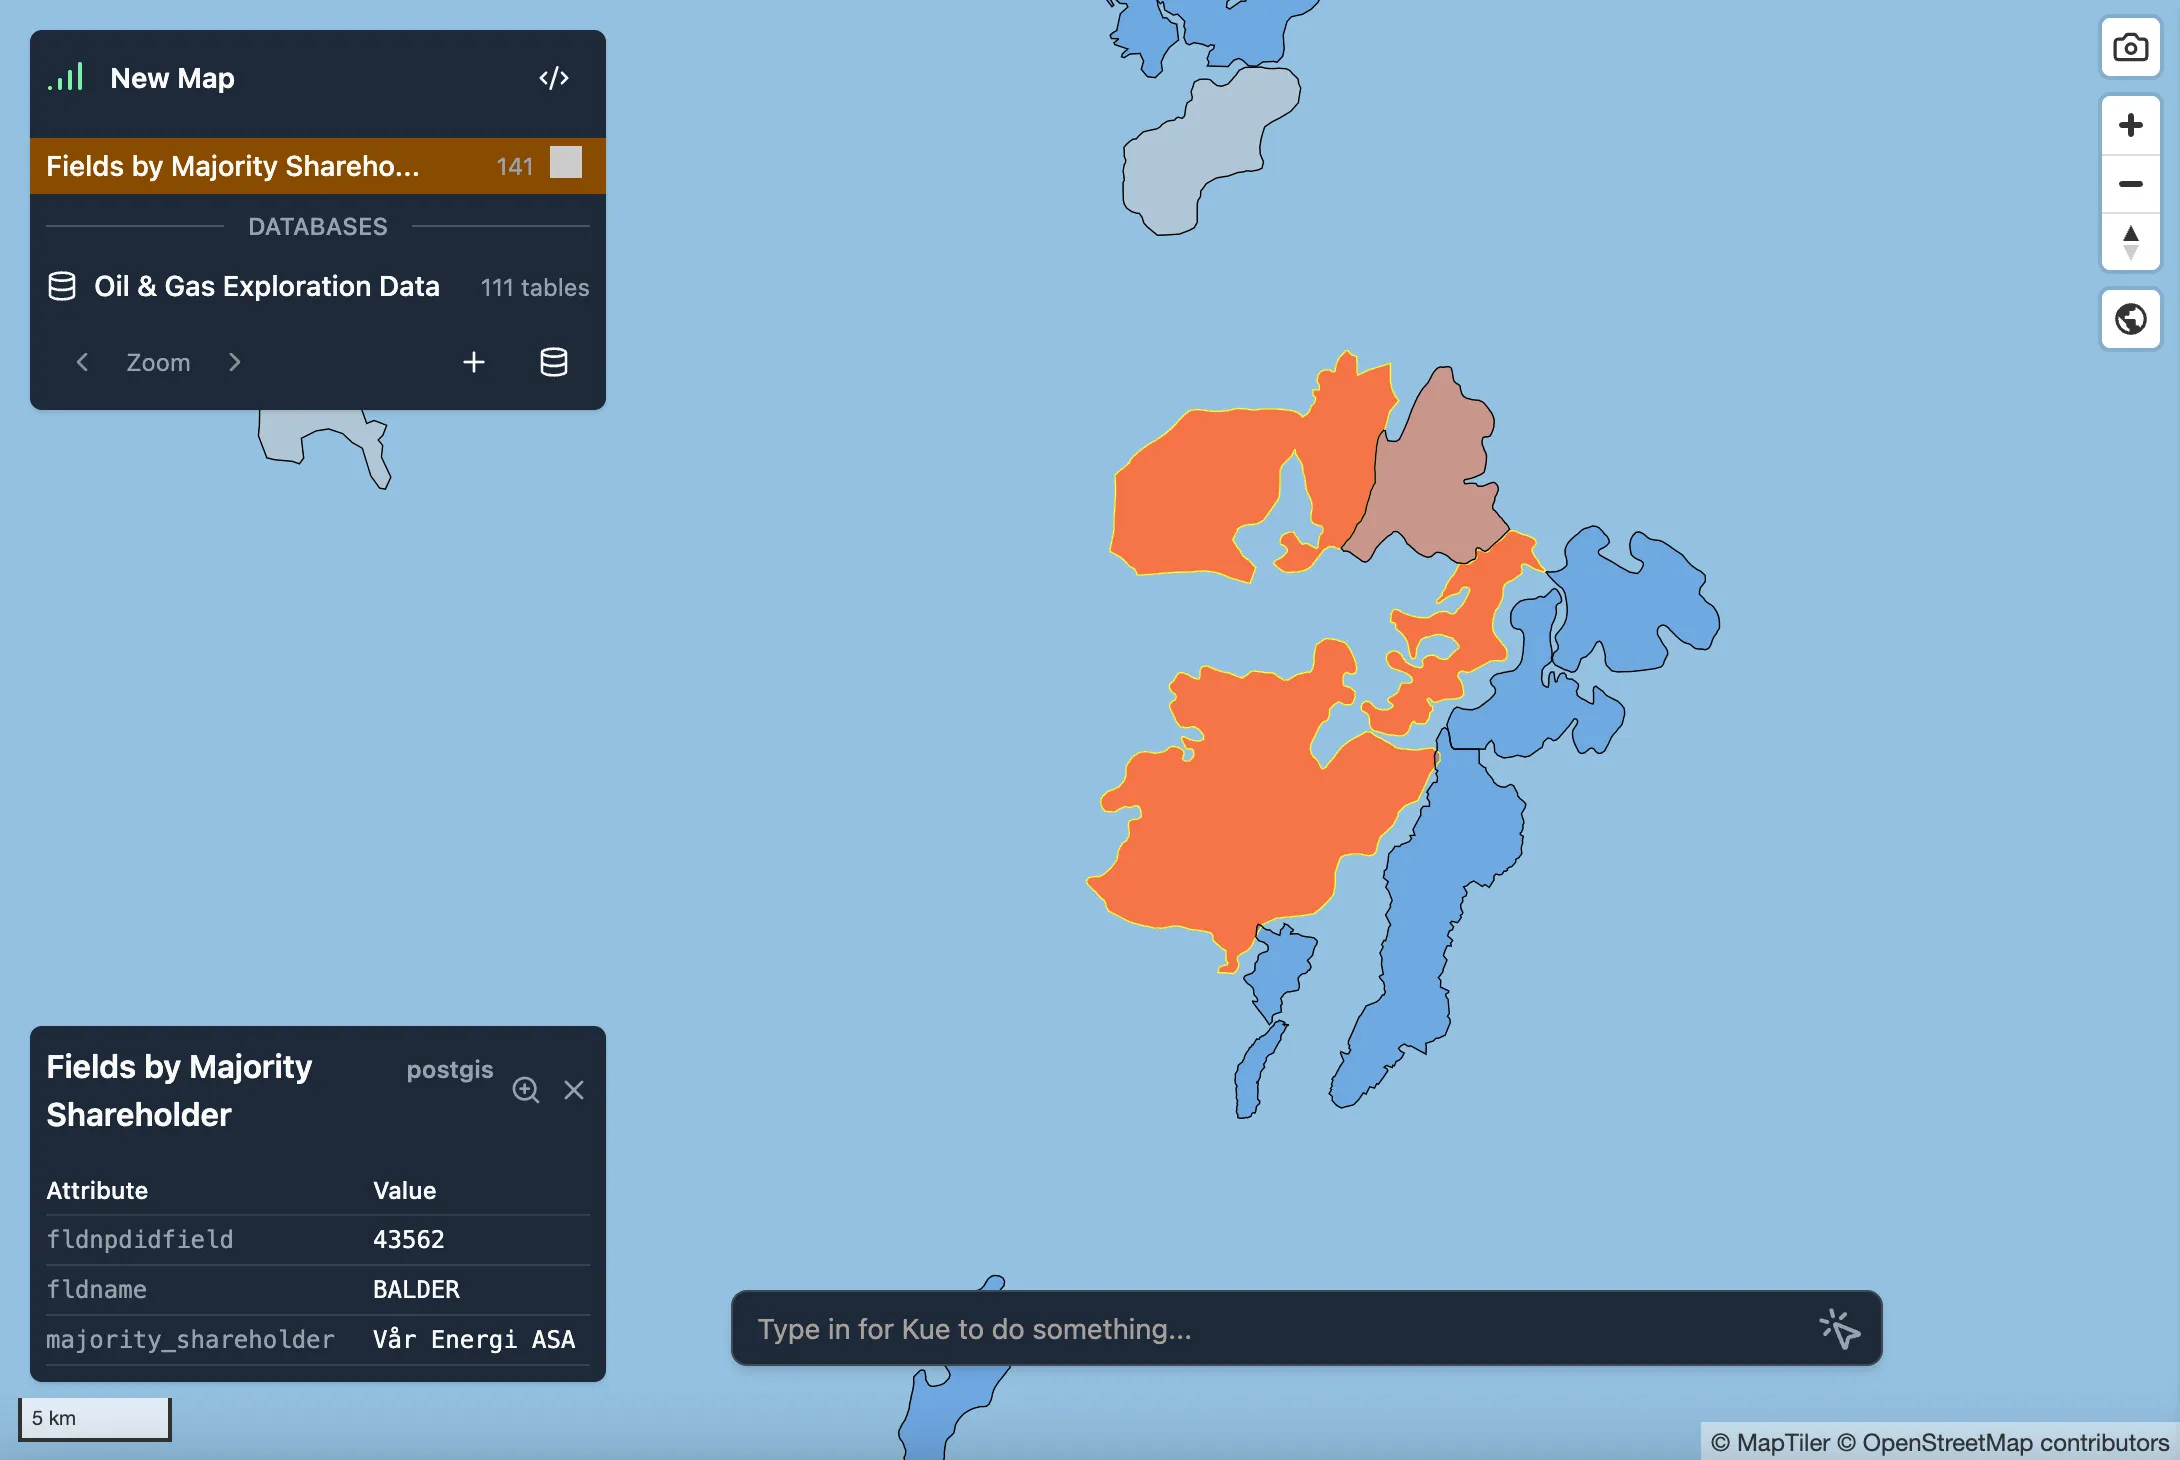
Section titled “Selecting features”Left clicking on a feature highlights its attributes in the bottom left portion of the map. In this example, I’ve highlighted an oil field to see who owns it.
Creating layers from PostGIS queries
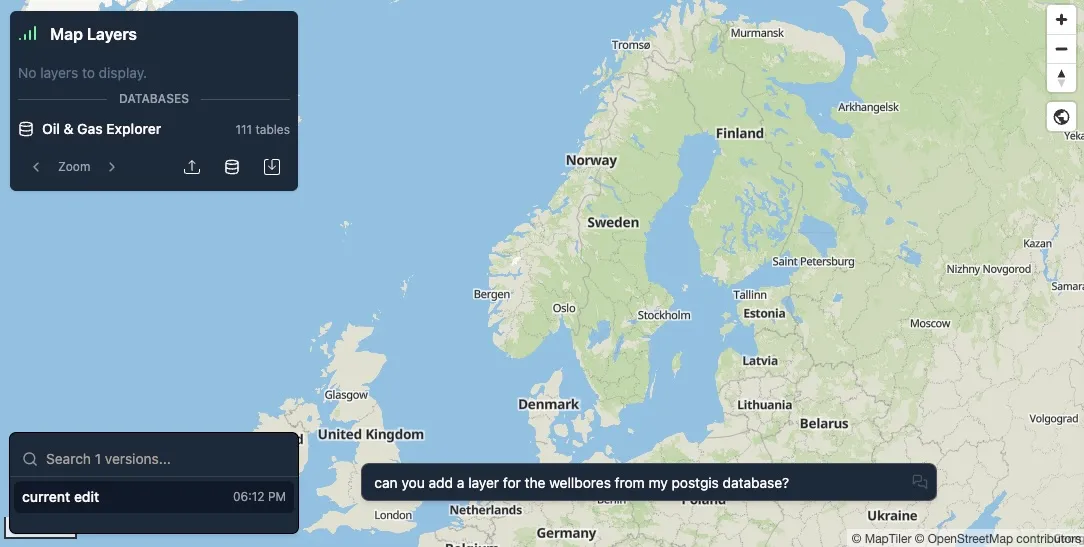
Section titled “Creating layers from PostGIS queries”Once connected, you can ask Kue, the AI assistant in Mundi, to create new map layers that source spatial data from the connected PostGIS database.
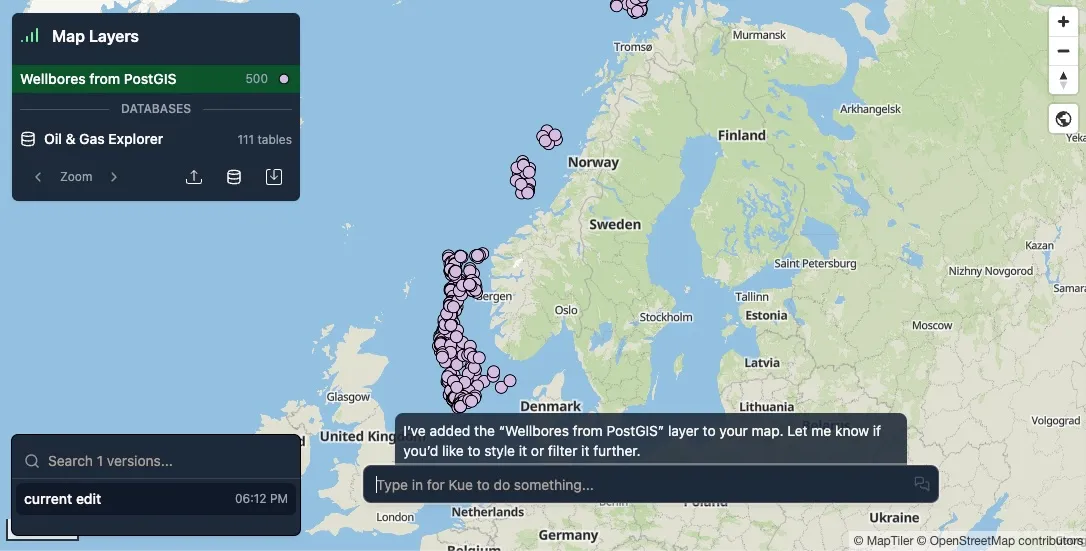
This creates a dynamic layer in Mundi that continuously pulls data from your PostGIS database:
Using symbology to analyze data
Section titled “Using symbology to analyze data”Kue is capable of adjusting a layer’s symbology to make it easier to interpret the data. This is possible with the size of layers, conditional symbology, graduated symbology, and with labels.
You can both specifically ask Kue to change symbology in a certain way (for example, turn the polygon layer blue or label the points with their name) and ask it to generally style a layer (for example, style the pipeline by its diameter).
Prompting tips
Section titled “Prompting tips”Mundi uses the strongest AI models available, so there is no need for any special prompting. You can either enter general requests which Kue will then try to best satisfy or be as specific as you would like, which it will also handle.
For general requests, Kue will do what it thinks best fits your goal. For example, if you ask Kue to “style the parks based on how many visitors they get in a year”, it might decide to label the parks with visitor count and give a color gradient where light is fewer visitors and dark is more.
You can also be as specific as you would like with any part of your prompt. Using the previous example, if you want Kue to label the parks with their name and to use a green color gradient where dark green is fewer visitors and light green is more, you just have to mention that.
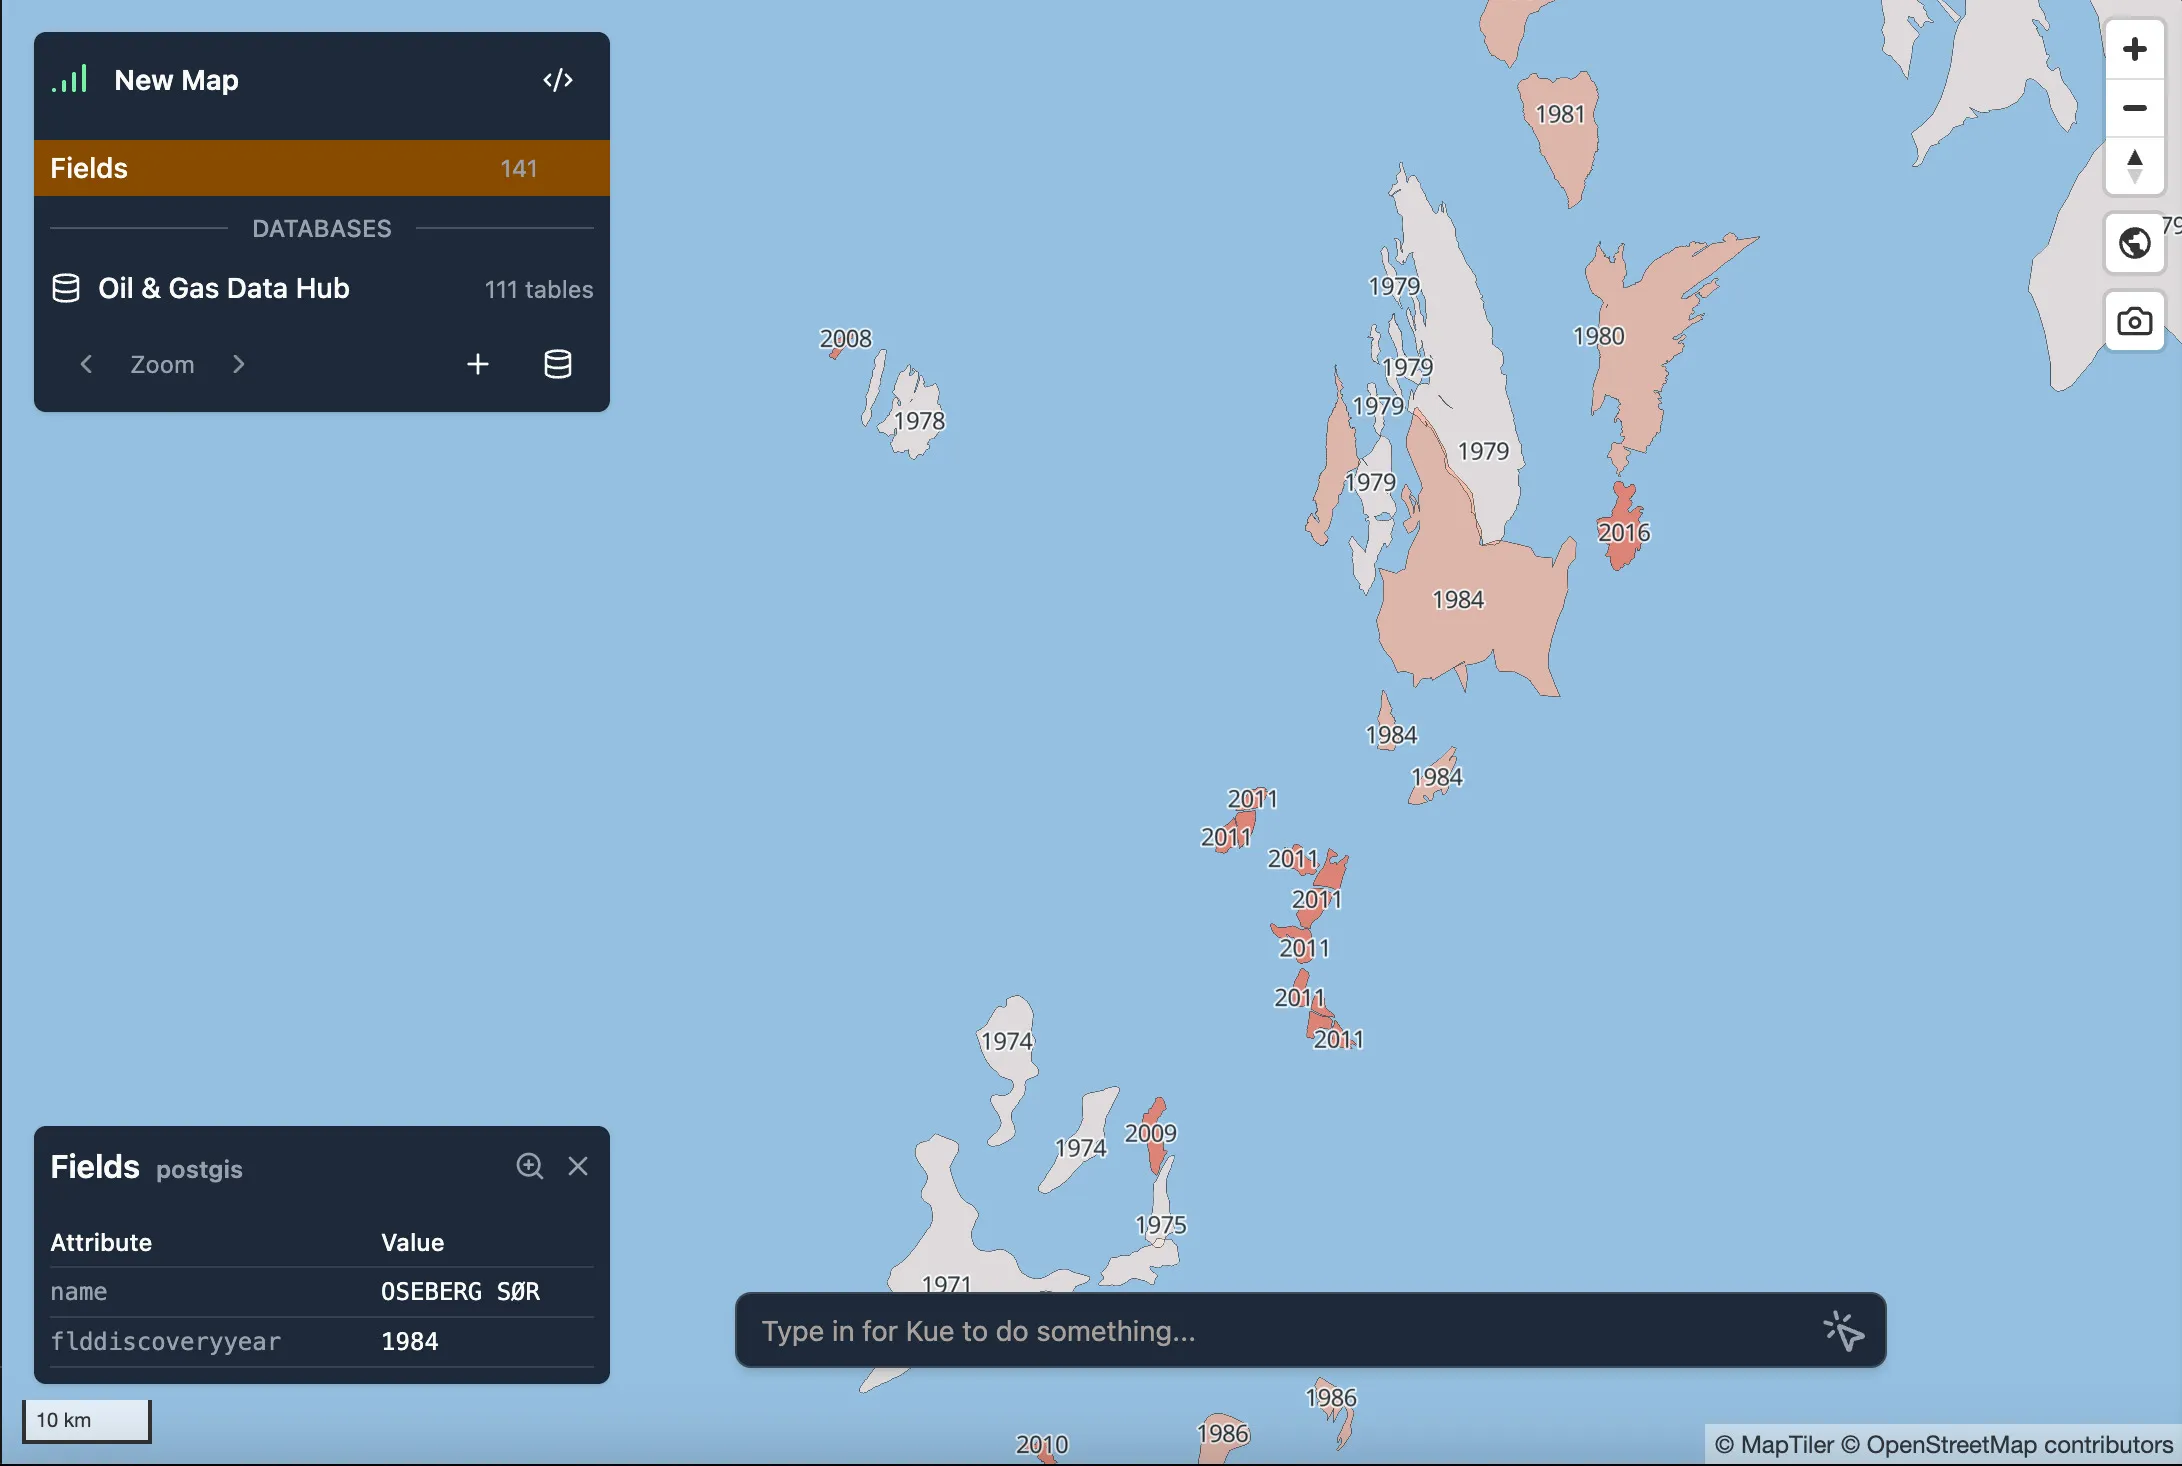
Graduated symbology
Section titled “Graduated symbology”One of the most powerful ways that Kue can easily make analysis understandable is through graduated symbology. This can be done to show, for example, a progression through time, a concentration, or any other gradient.
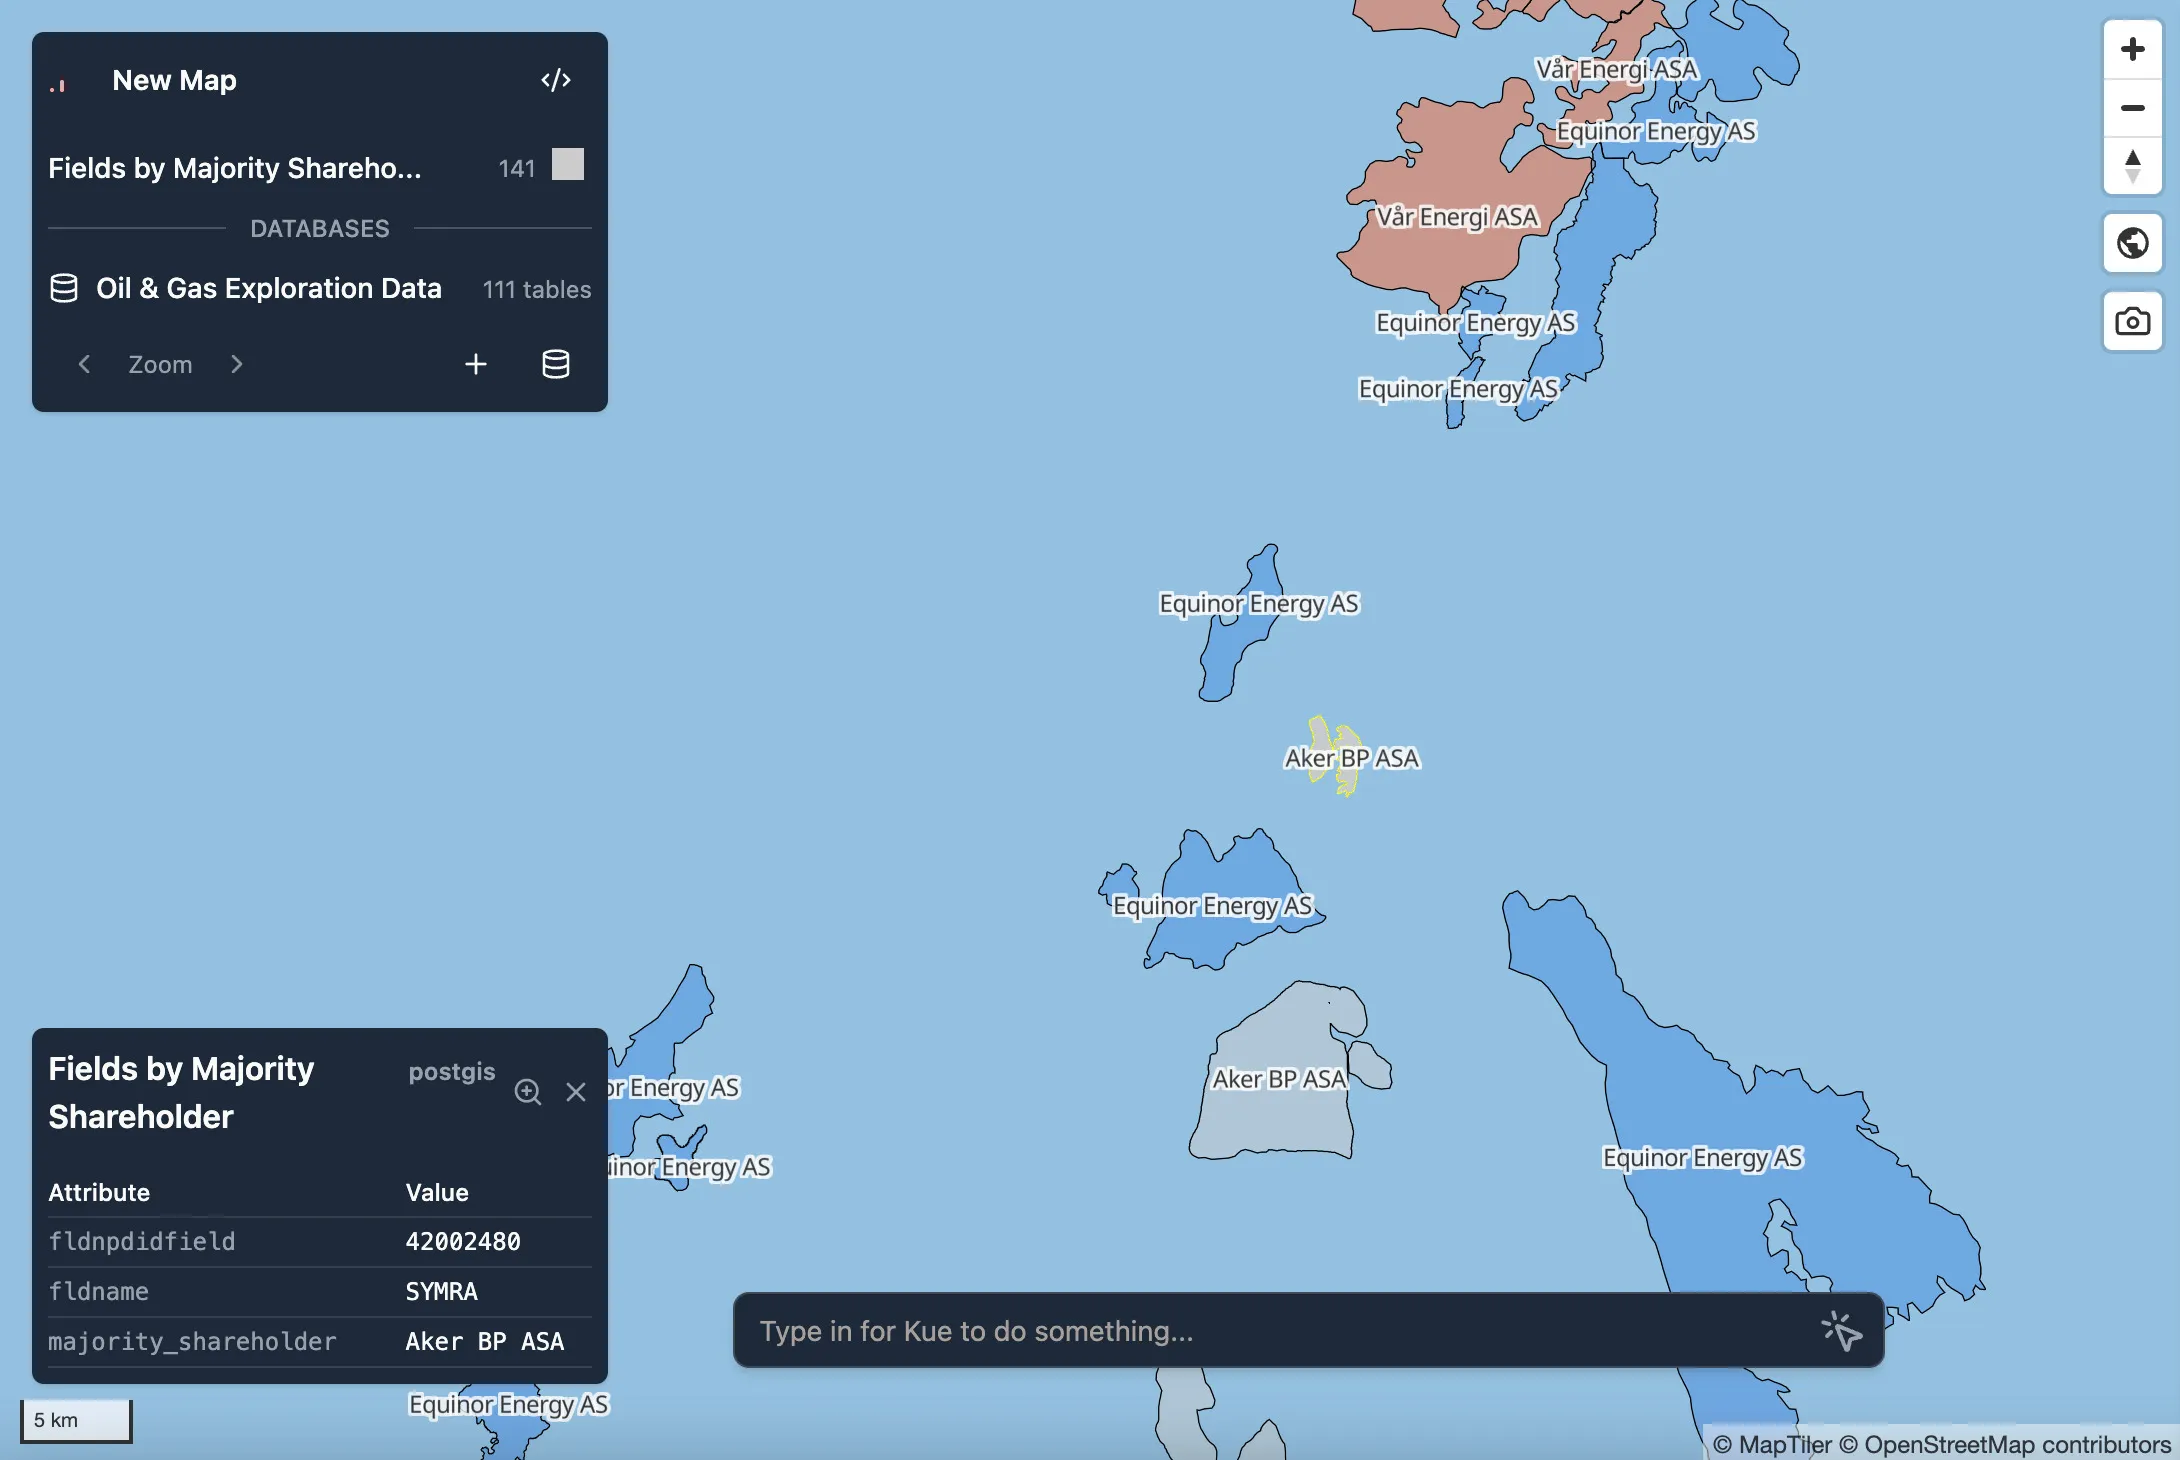
Conditional symbology
Section titled “Conditional symbology”If you want to show different groups of data you can use conditional symbology. If you ask Kue to style based on an attribute that is not a scale but instead are discrete, it will create conditional symbology based on the attributes. So attribute A will be red, attribute B will be blue, and so on.
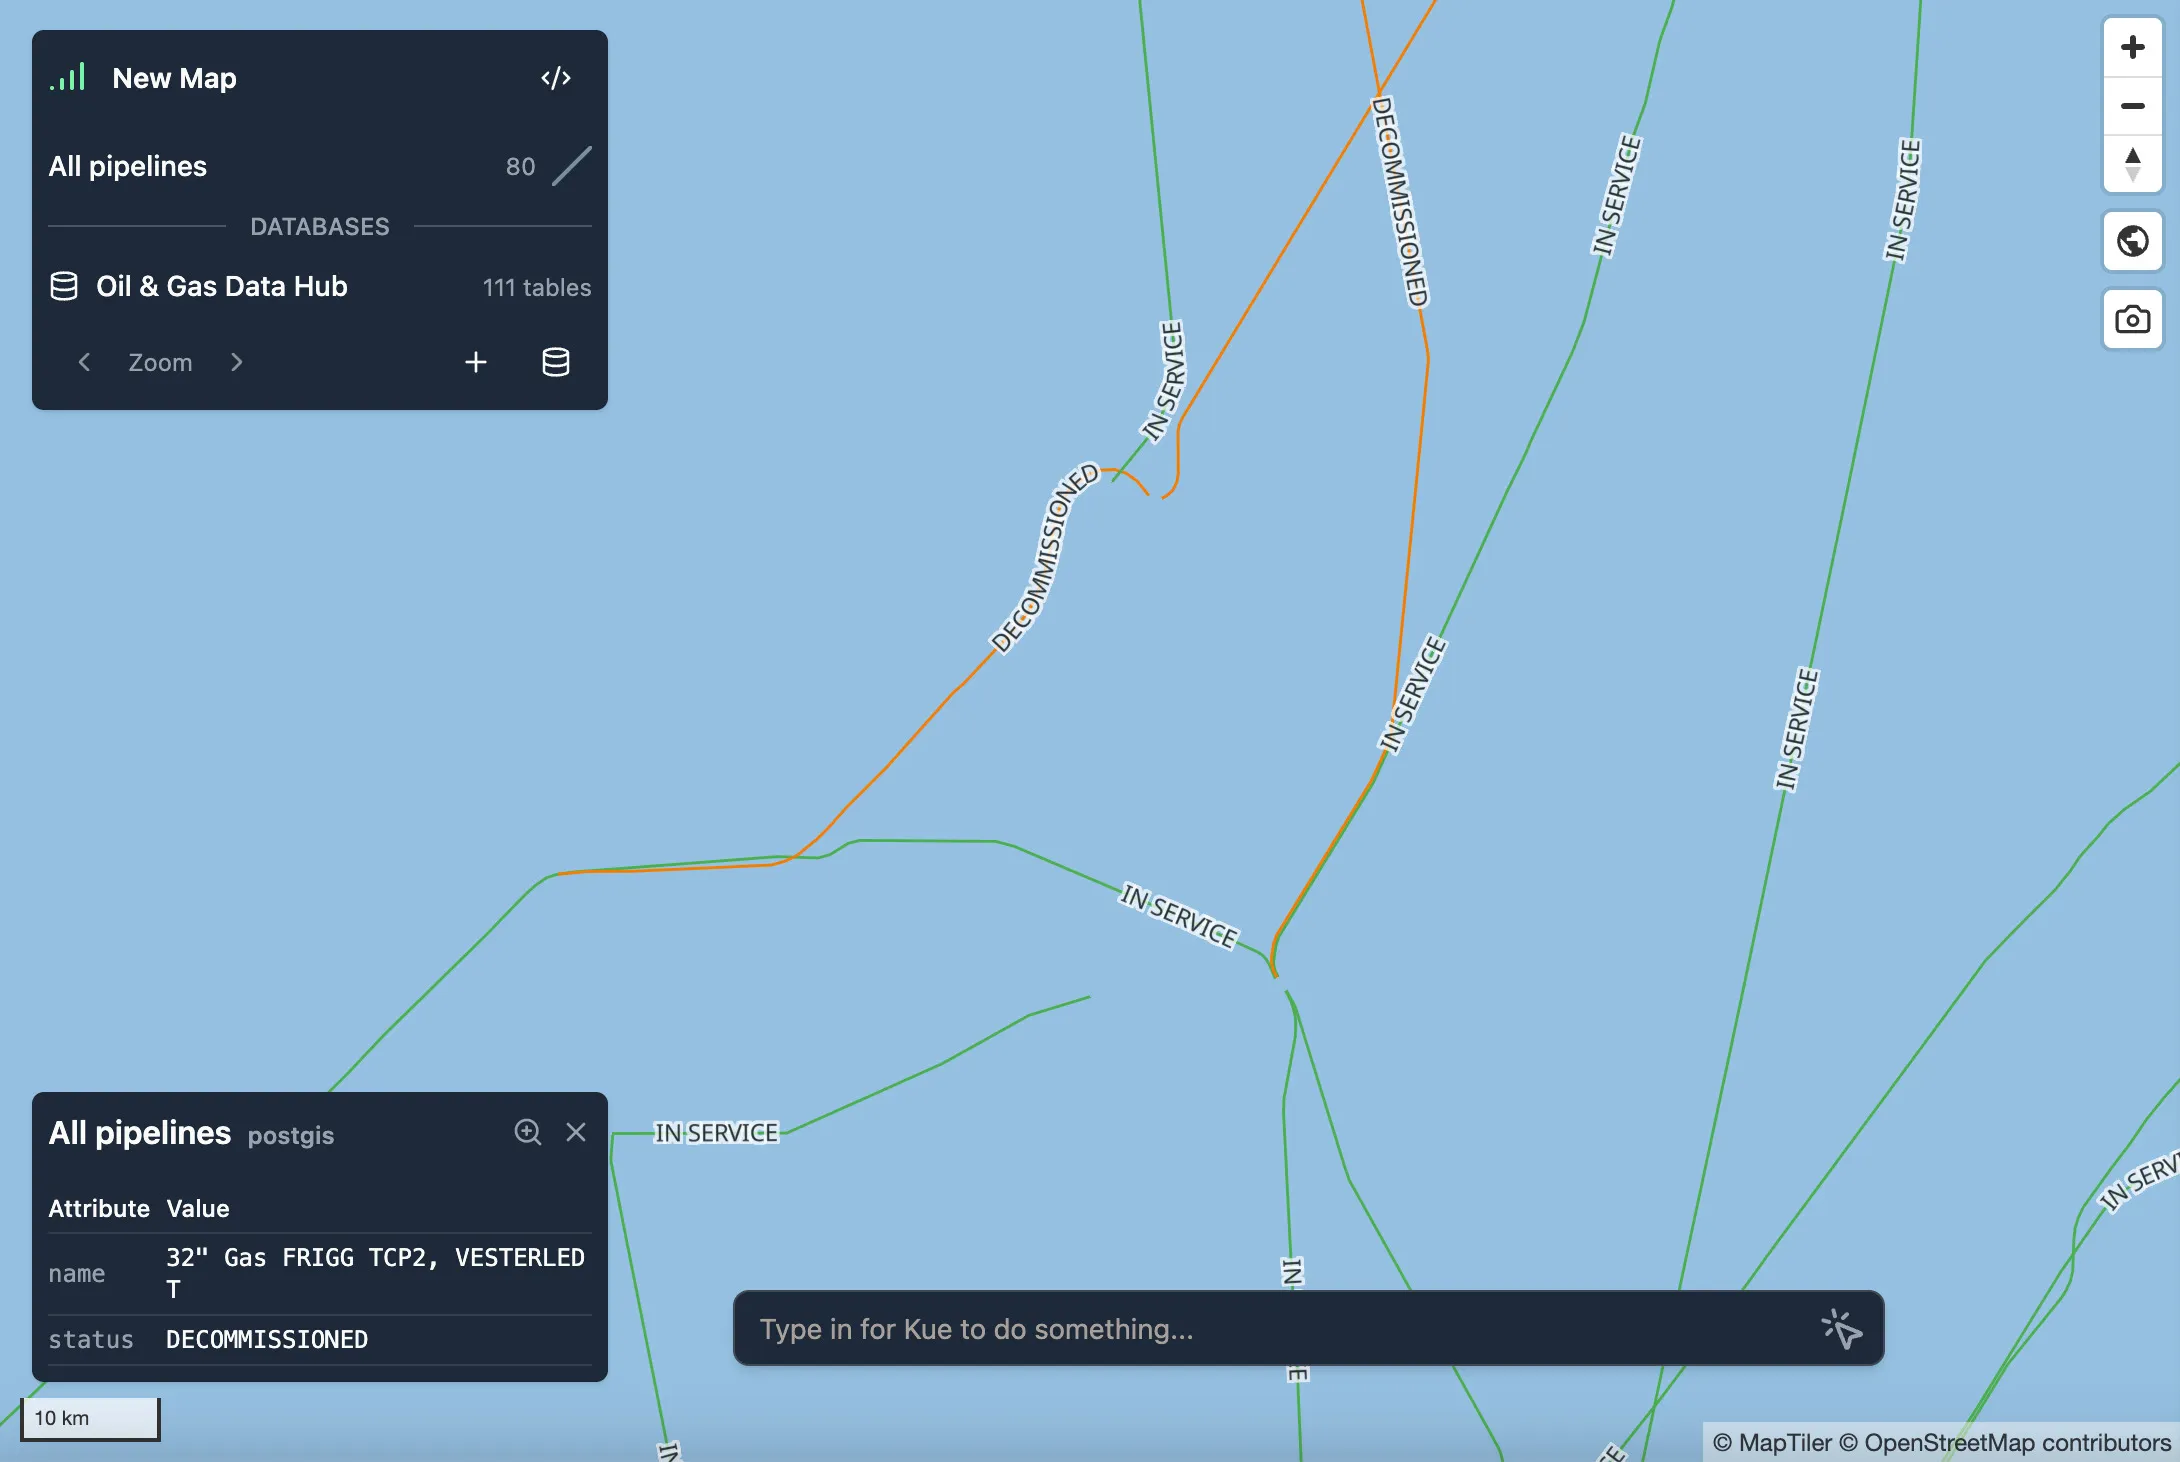
Adding labels to data
Section titled “Adding labels to data”You can label a layer based on any attribute.
Combining analysis requests with symbology
Section titled “Combining analysis requests with symbology”If you have multiple layers from your spatial database and want to see how they interact, Kue can run complex SQL to combine them, find a new insight, and make the insight visual via symbology.
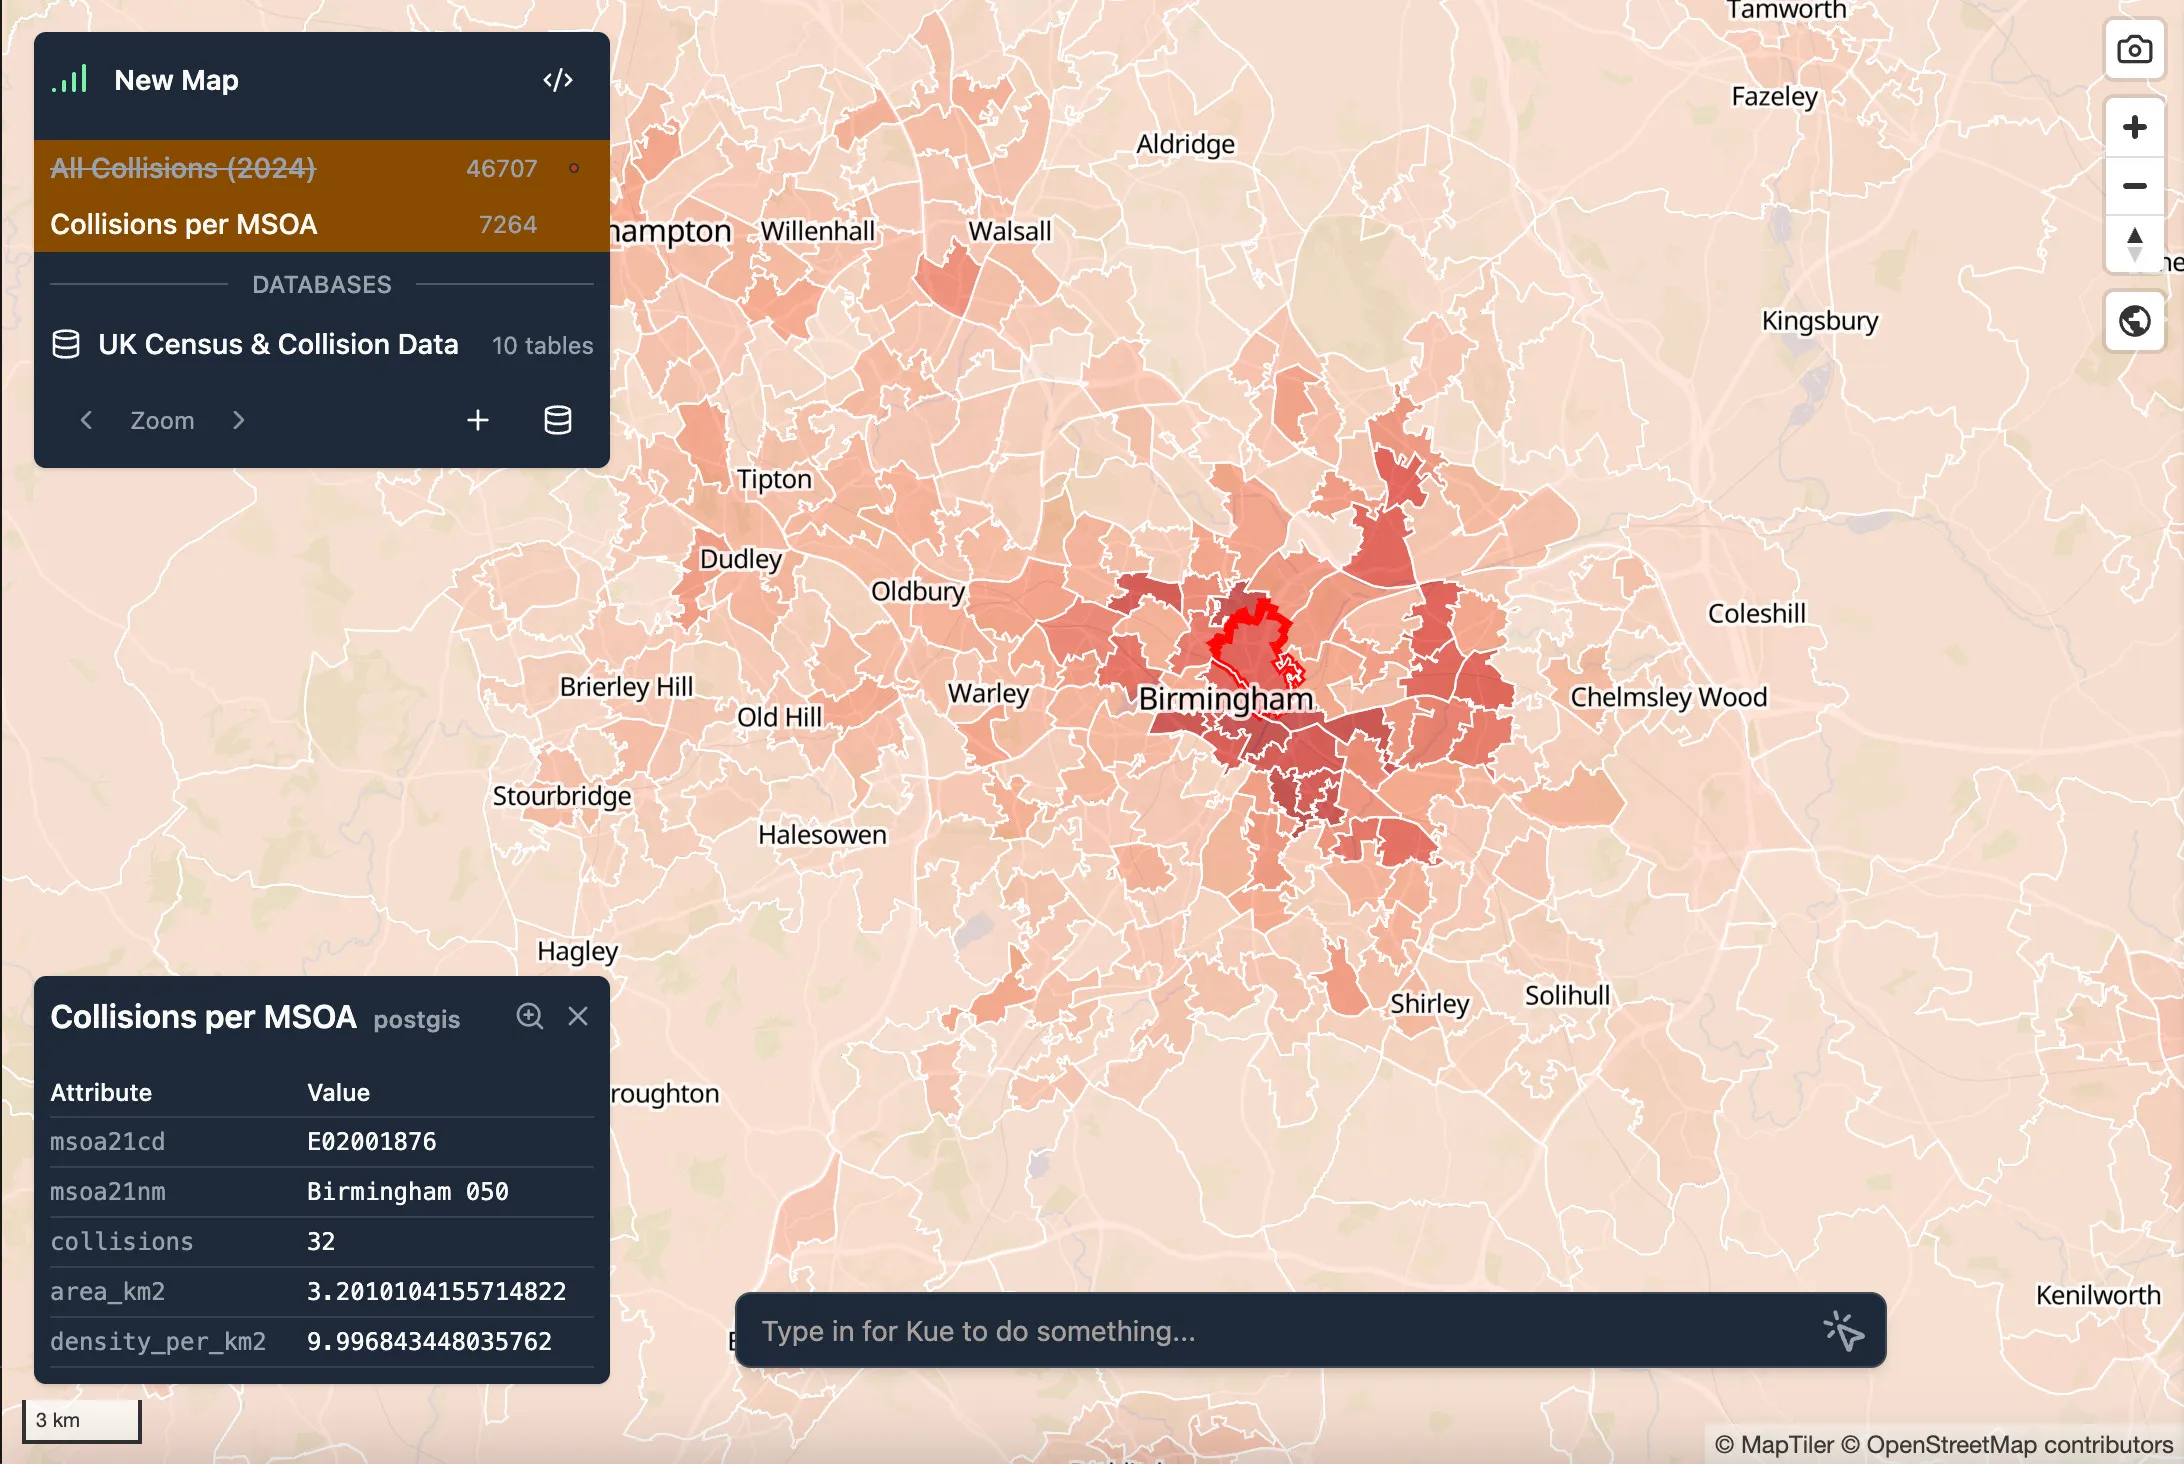
Kue’s SQL
SELECT m.fid AS id, m.msoa21cd, m.msoa21nm, COUNT(c.collision_index) AS collisions, ST_Area(m.shape)/1000000.0 AS area_km2, COUNT(c.collision_index) / (ST_Area(m.shape)/1000000.0) AS density_per_km2, m.shape AS geomFROM census2021.msoa_2021_ew_bgc_v3 AS mLEFT JOIN stats19.dft_collision_2024 AS c ON ST_Within(c.geom, m.shape)GROUP BY m.fid, m.msoa21cd, m.msoa21nm, m.shape